Source-Level Debugging for the Atari Lynx
I work on several Atari Lynx projects, mostly with cc65, which compiles C down to 6502 assembly and then into a cartridge image. Emulators help with debugging, but you’re looking at assembly, not at the C you wrote.
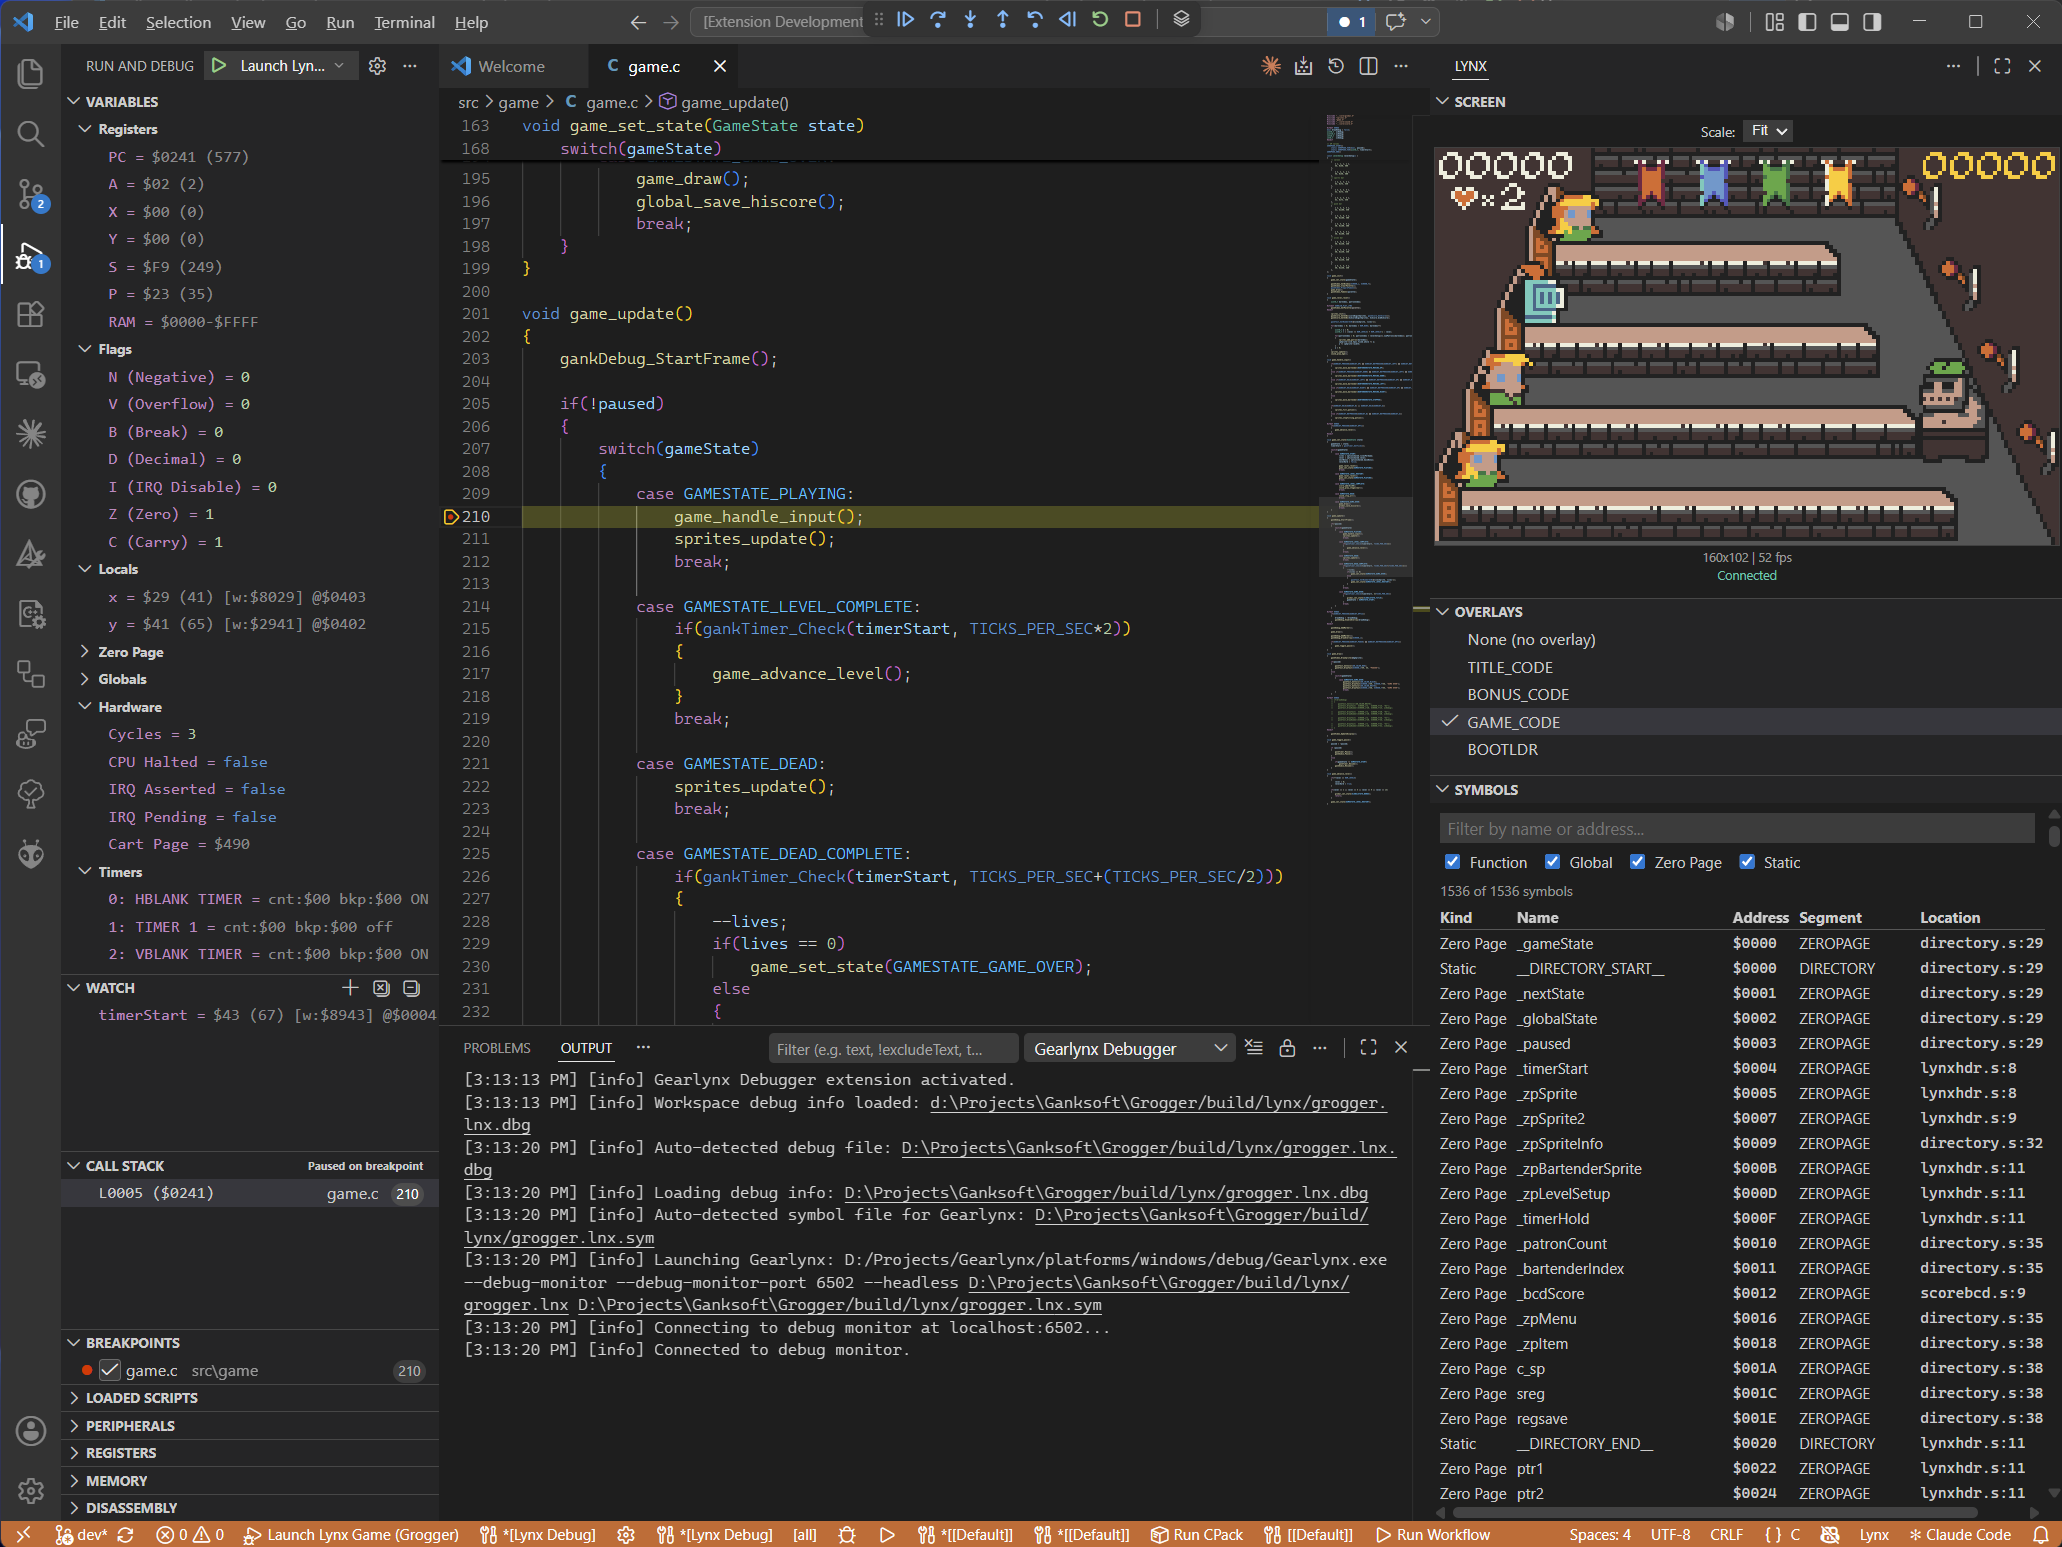
So I built a source-level debugger on top of the Gearlynx emulator. Gearlynx Debugger is a VS Code extension that gives you breakpoints in your C files, real local variables, the call stack, hardware state, and the game running live in a panel next to your code.
The Starting Point
Gearlynx is Nacho Sánchez Ginés’s Lynx emulator, and it’s excellent. It already ships a capable debugger with a run-ahead disassembler, CPU and memory breakpoints, a memory editor, and hardware viewers for Mikey and Suzy.
But it is a 6502 level debugger. To break on game_handle_input(), you dig its address out of the cc65 map file, type it in, and read disassembly. When you stop, you get registers and raw memory instead of x, y, and gameState.
VS Code already has the other half, built in and driven by the Debug Adapter Protocol (DAP), and cc65 can emit a debug file during the build with most of what’s needed to fill that UI in. The missing piece was something to connect the two.
Two Halves
The project ended up being two separate things:
- A debug-monitor server inside Gearlynx: C++, a TCP server exposing emulator state and execution control over a simple JSON protocol. This got upstreamed and ships in Gearlynx as of 1.2.15.
- The VS Code extension: TypeScript, a DAP adapter speaking that protocol on one side and VS Code on the other, plus all the cc65 debug info parsing.
Split that way, the emulator knows nothing about VS Code, cc65, or DAP. It answers questions about registers, memory, and breakpoints, and everything that requires understanding your source code lives in the extension.
The Gearlynx MCP Server Did the Hard Part
Gearlynx added Model Context Protocol support back in December 2025, so an AI agent could drive the emulator: set breakpoints, read memory, inspect Mikey and Suzy, step the CPU. Making that work meant giving every debugger capability a programmatic handle, which lives in a DebugAdapter class, a plain C++ facade over the emulator core that hands back structs and JSON.
That facade is exactly what a debug monitor needs, so I didn’t write another one. The monitor is a second transport over the same adapter, and almost every command in it is a thin translation from a struct into JSON. Both servers sit in emu.cpp and get pumped from the same place in the emulator loop.
So the AI tooling work paid off in a completely non-AI way. Building the MCP server forced every debugger capability to have a name, a signature, and a return type that wasn’t a UI widget, and once that boundary existed, hanging a second protocol off it was mostly plumbing.
VS Code                              Gearlynx
+-------------------+   TCP/JSON     +---------------------+
| Gearlynx Debugger | <------------> | Debug Monitor       |
| (DAP adapter)     |   port 6502    | Server              |
+-------------------+                +---------------------+
|                   |   TCP/binary   | Framebuffer         |
| Screen Viewer     | <------------> | Server              |
| (webview panel)   |   port 6503    | (60fps RGBA stream) |
+-------------------+                +---------------------+
                                     | Emulator Core       |
                                     +---------------------+
Speaking DAP
The DAP overview covers most of the mapping. stackTrace, scopes, and variables handle the call stack and locals, setBreakpoints and setDataBreakpoints handle source breakpoints and watchpoints, readMemory and writeMemory sit behind the hex editor, and disassemble feeds the disassembly view. Each of those lands on one of about 20 JSON commands the monitor understands, plus a few events like stopped that arrive on their own when the emulator hits a breakpoint. Even rewind lands on a real protocol feature instead of a hack, since the spec has stepBack and reverseContinue gated behind a supportsStepBack capability.
The one place a retro handheld and a protocol built for modern runtimes don’t line up is threads. DAP references a thread id from the stack, the scopes, and the variables, and a 65C02 has no concept of a thread. The spec’s answer is to report a single dummy thread and move on.
Making cc65 Debug Info Useful
This is where the actual work was.
Building with cl65 -t lynx -g --dbgfile game.dbg produces a .dbg file containing symbols, scopes, spans, C symbols (csym), segments, and line info. There is no published description of the format in the cc65 docs. The ld65 docs cover the flag and not much else.
The best reference is the cc65 source at src/dbginfo. The file is plain line-oriented text: a version line, an info line of counts so a reader can preallocate, then tab-separated sym, scope, span, line, and csym records, each a comma-separated list of key=value pairs. src/dbginfo also includes dbgsh, a small interactive shell for querying a .dbg file, handy for seeing what’s actually in yours.
A few of the more interesting problems:
Switch Statements Lie
cc65 maps the jump-table dispatch code for a switch to the closing brace of the block. Step over switch(gameState) and you land on the } at the bottom, and then the next step takes you into the matching case.
Overlays Make the Address Space Ambiguous
The Lynx cart isn’t mapped into the address space at all. No banking, no window you switch between. The cart is a serial stream, and everything the CPU executes has to be loaded off the cart into RAM first. With 64KB total, most games can’t hold all of their code at once.
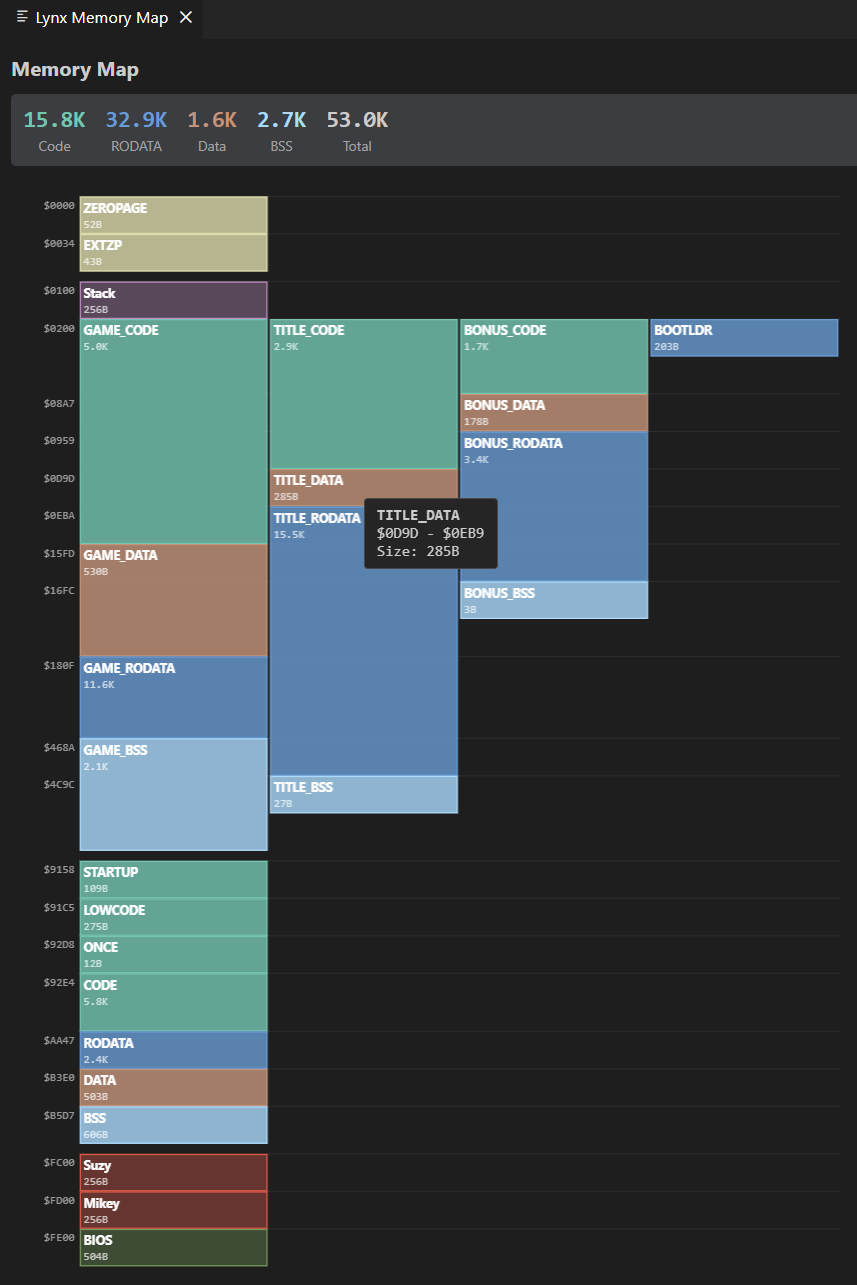
So cc65 gives you overlay segments: multiple code segments linked to the same RAM addresses, loaded on demand, one resident at a time. Grogger, the game in the screenshot above, has TITLE_CODE, BONUS_CODE, and GAME_CODE all built for the same range, and which one is actually sitting there depends on what the game last chose to load.
That means “what source line is at $A400?” has no single answer, and the debug info can’t tell you either, since it describes all of them equally. The extension detects overlay groups and lets you pick which one to treat as resident, from the debug toolbar or the Overlays panel. Data-only overlays are filtered out of the picker.
Zero Page Symbols Resolving to the Wrong File
A real bug, fixed in 0.2.5. Lynx builds have EXEHDR and DIRECTORY segments that alias to address 0, same as ZEROPAGE and EXTZP. Every zero-page symbol was resolving its “source location” to lynxhdr.s or directory.s, technically an address match and completely useless. They now resolve to the file that actually declares them wherever the debug info allows it.
Source-Line Stepping
DAP wants to step one line. The emulator steps one 6502 instruction and has no idea where a C function begins or ends, so bridging those means stepping instructions in a loop until the source line changes.
A single line of C can be dozens of instructions. A line with a function call needs the step to run through the whole call and come back, not stop inside it. A line the compiler split across non-contiguous spans needs to not look like it changed when it didn’t. And there has to be an iteration cap, because if the mapping is wrong somewhere, you do not want the debugger single-stepping forever.
A traceSteps launch option logs every stepping decision to the Debug Console. It exists because I needed it to get this working.
The Screen Viewer
Gearlynx can run --headless, and with the debug monitor enabled, the framebuffer server streams RGBA frames over raw TCP on port 6503, an 8-byte header of width, height, and size followed by the pixels. Audio plays from the emulator while it’s hidden. The extension renders into a dockable webview panel at 60fps with integer scaling from 1x to 5x, and forwards keyboard events back as Lynx button presses.
So you never leave the editor. I run it with the info panels on the left, source in the middle, and the game on the right, as in the screenshot above.
Features
- Source breakpoints, conditionals (
A == 0,$FC00 > 5), hit counts, logpoints, data watchpoints, function breakpoints, and raw instruction breakpoints - Step in, over, out, continue, pause, and frame-level step back using Gearlynx’s rewind
- Registers with individual flag bits, locals, globals, a Zero Page scope with live values, and hardware status for Mikey timers, audio channels, LCD, and cart
- A filterable Symbol Table panel, a Memory Map canvas view of the address space, a Trace Logger, Loaded Sources, and memory editing through VS Code’s hex editor
Getting Started
- Install Gearlynx 1.2.15 or later and configure a Lynx BIOS image in it
- Install Gearlynx Debugger from the VS Marketplace
- Point
gearlynxDebug.gearlynxPathat your Gearlynx executable - Build your Lynx code with debug info:
cl65 -t lynx -g --dbgfile game.dbg -o game.lnx main.c - Press F5
With no launch.json, the extension scans your workspace for a .lnx/.lyx ROM, auto-detects the matching .dbg or .sym next to it, and starts debugging headless. Write a launch.json if you want a different port, stopOnEntry, or extra sourceRoots. For assembly-only projects with no .dbg file, it falls back to .sym files, so you lose source-line mapping and locals but keep symbol names.
Thanks and Links
Huge thanks to Nacho Sánchez Ginés for Gearlynx itself and for taking the debug-monitor work upstream so the extension can run against stock releases instead of a fork.
- Gearlynx Debugger on the VS Marketplace
- gearlynx-vscode on GitHub
- Gearlynx emulator
- Debug-monitor protocol documentation
- Debug Adapter Protocol overview
- Debug Adapter Protocol specification
If you’re writing Lynx code with this and something’s broken, please open an issue.